Science Art and Visualizations
1
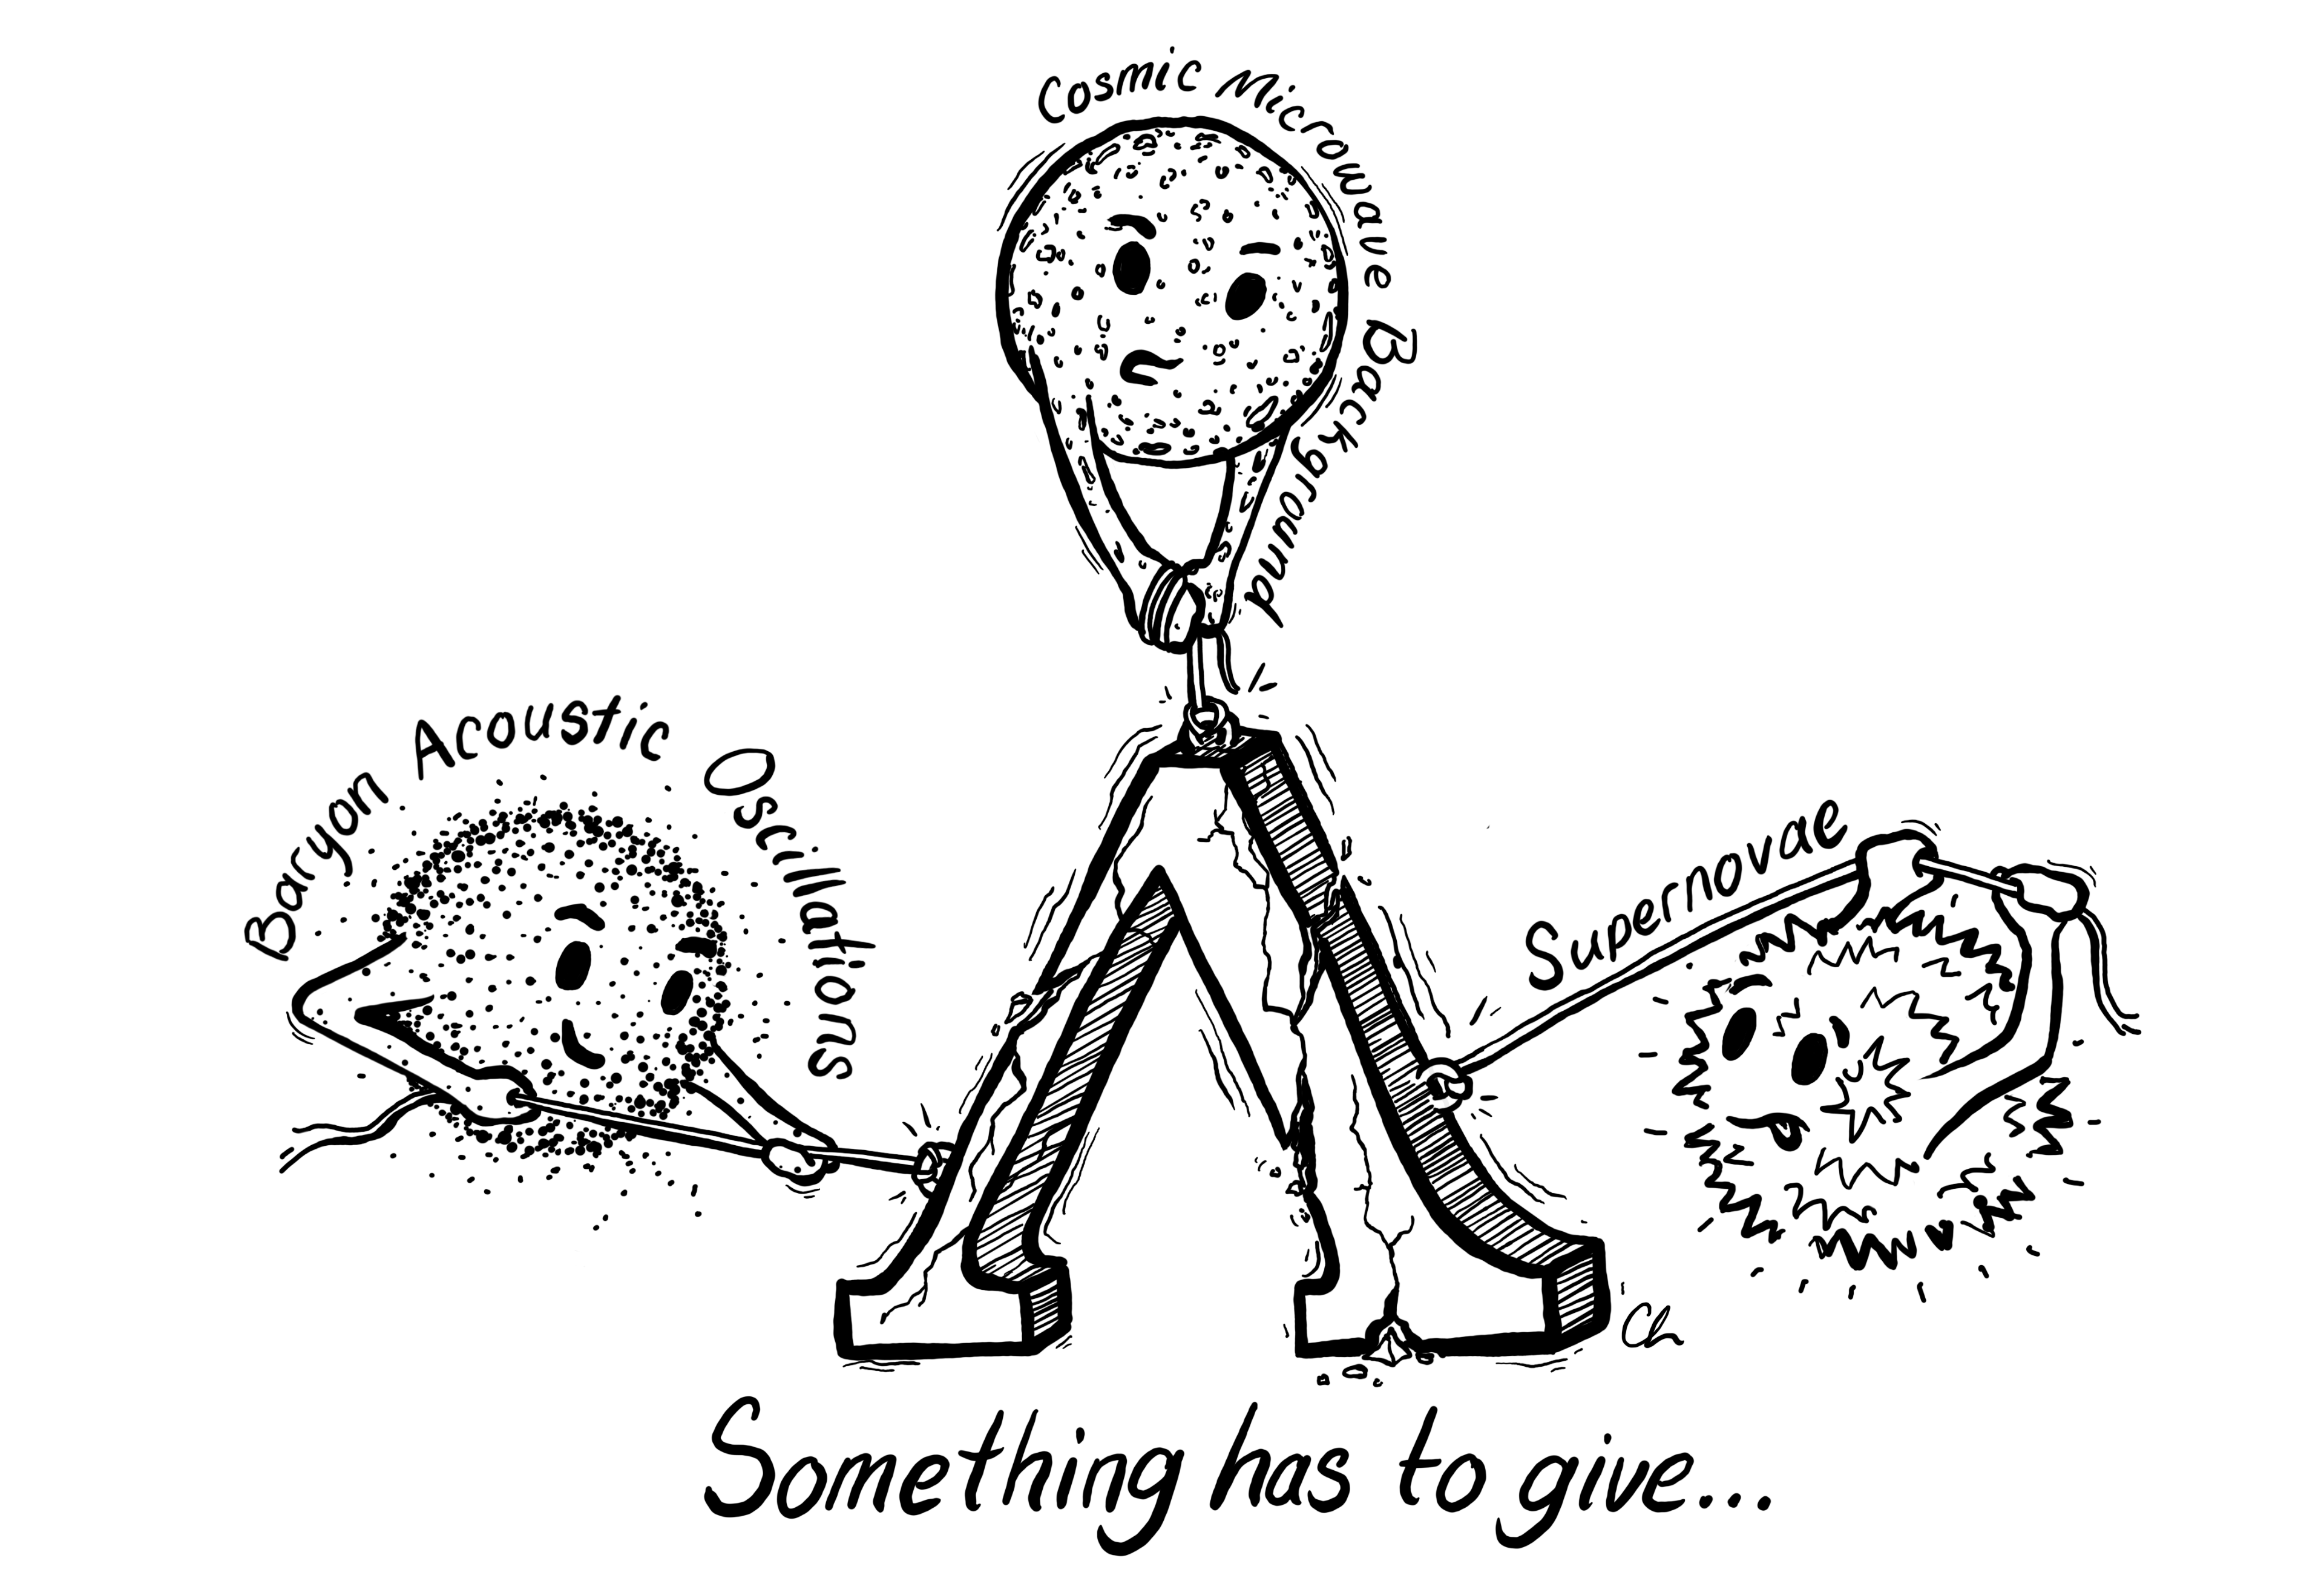
Something must give. A visualization of recent dark energy results from the DESI Survey.Credit: Claire Lamman
2
Cosmic Cartography. An old-style map celebrating DESI's efforts to chart the Universe. See this blog post
for a description of the details. Credit: Claire Lamman
3
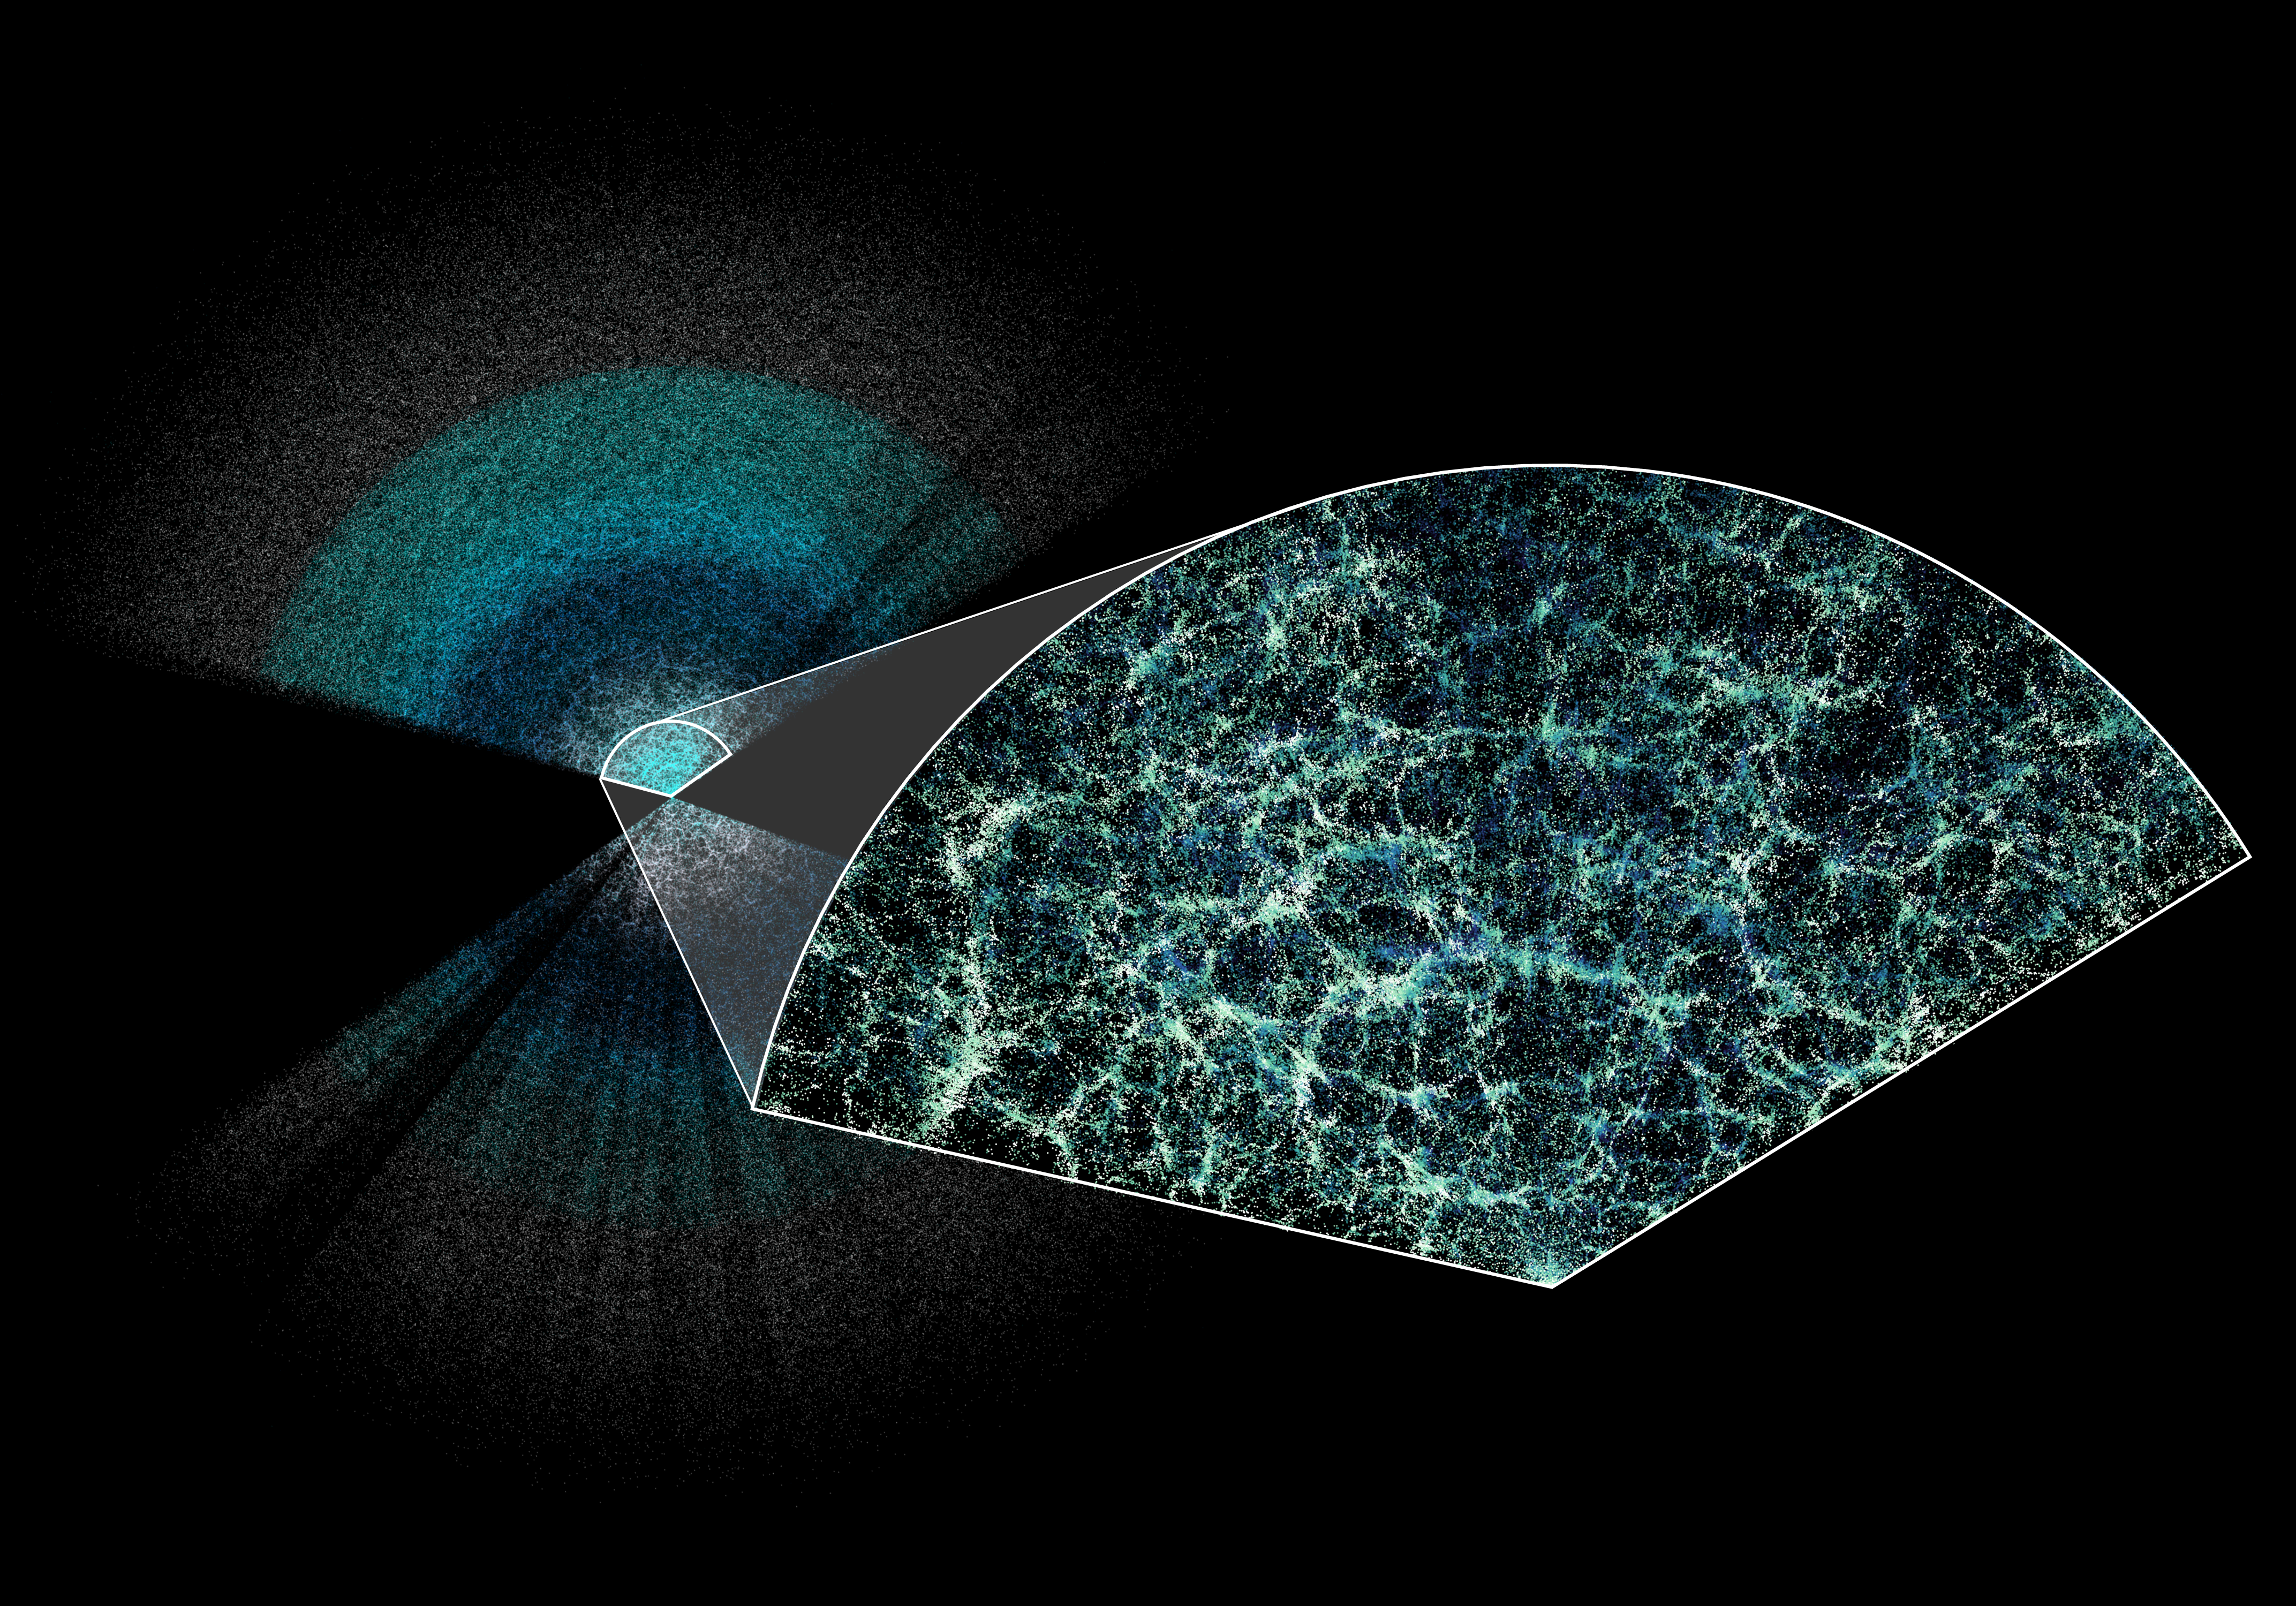
This key figure used in DESI's Y1 the press release, displaying a narrow band on the sky spanning 190 degrees in right ascension and 14 degrees in declination.
The magnified section consists of galaxies from our Bright Galaxy Sample and extends to a redshift of 0.2. The colors are scaled by declination to show depth in the slice: darker colors are "behind" brighter structure.
In the background "butterfly", colors correspond to different types of galaxies observed: Bright Galaxy Survey, Luminous Red Galaxies, Emission Line Galaxies, and Quasars.
This represents less than 0.1% of our full survey volume. Image credit: Claire Lamman/DESI collaboration; custom colormap package by cmastro.
4
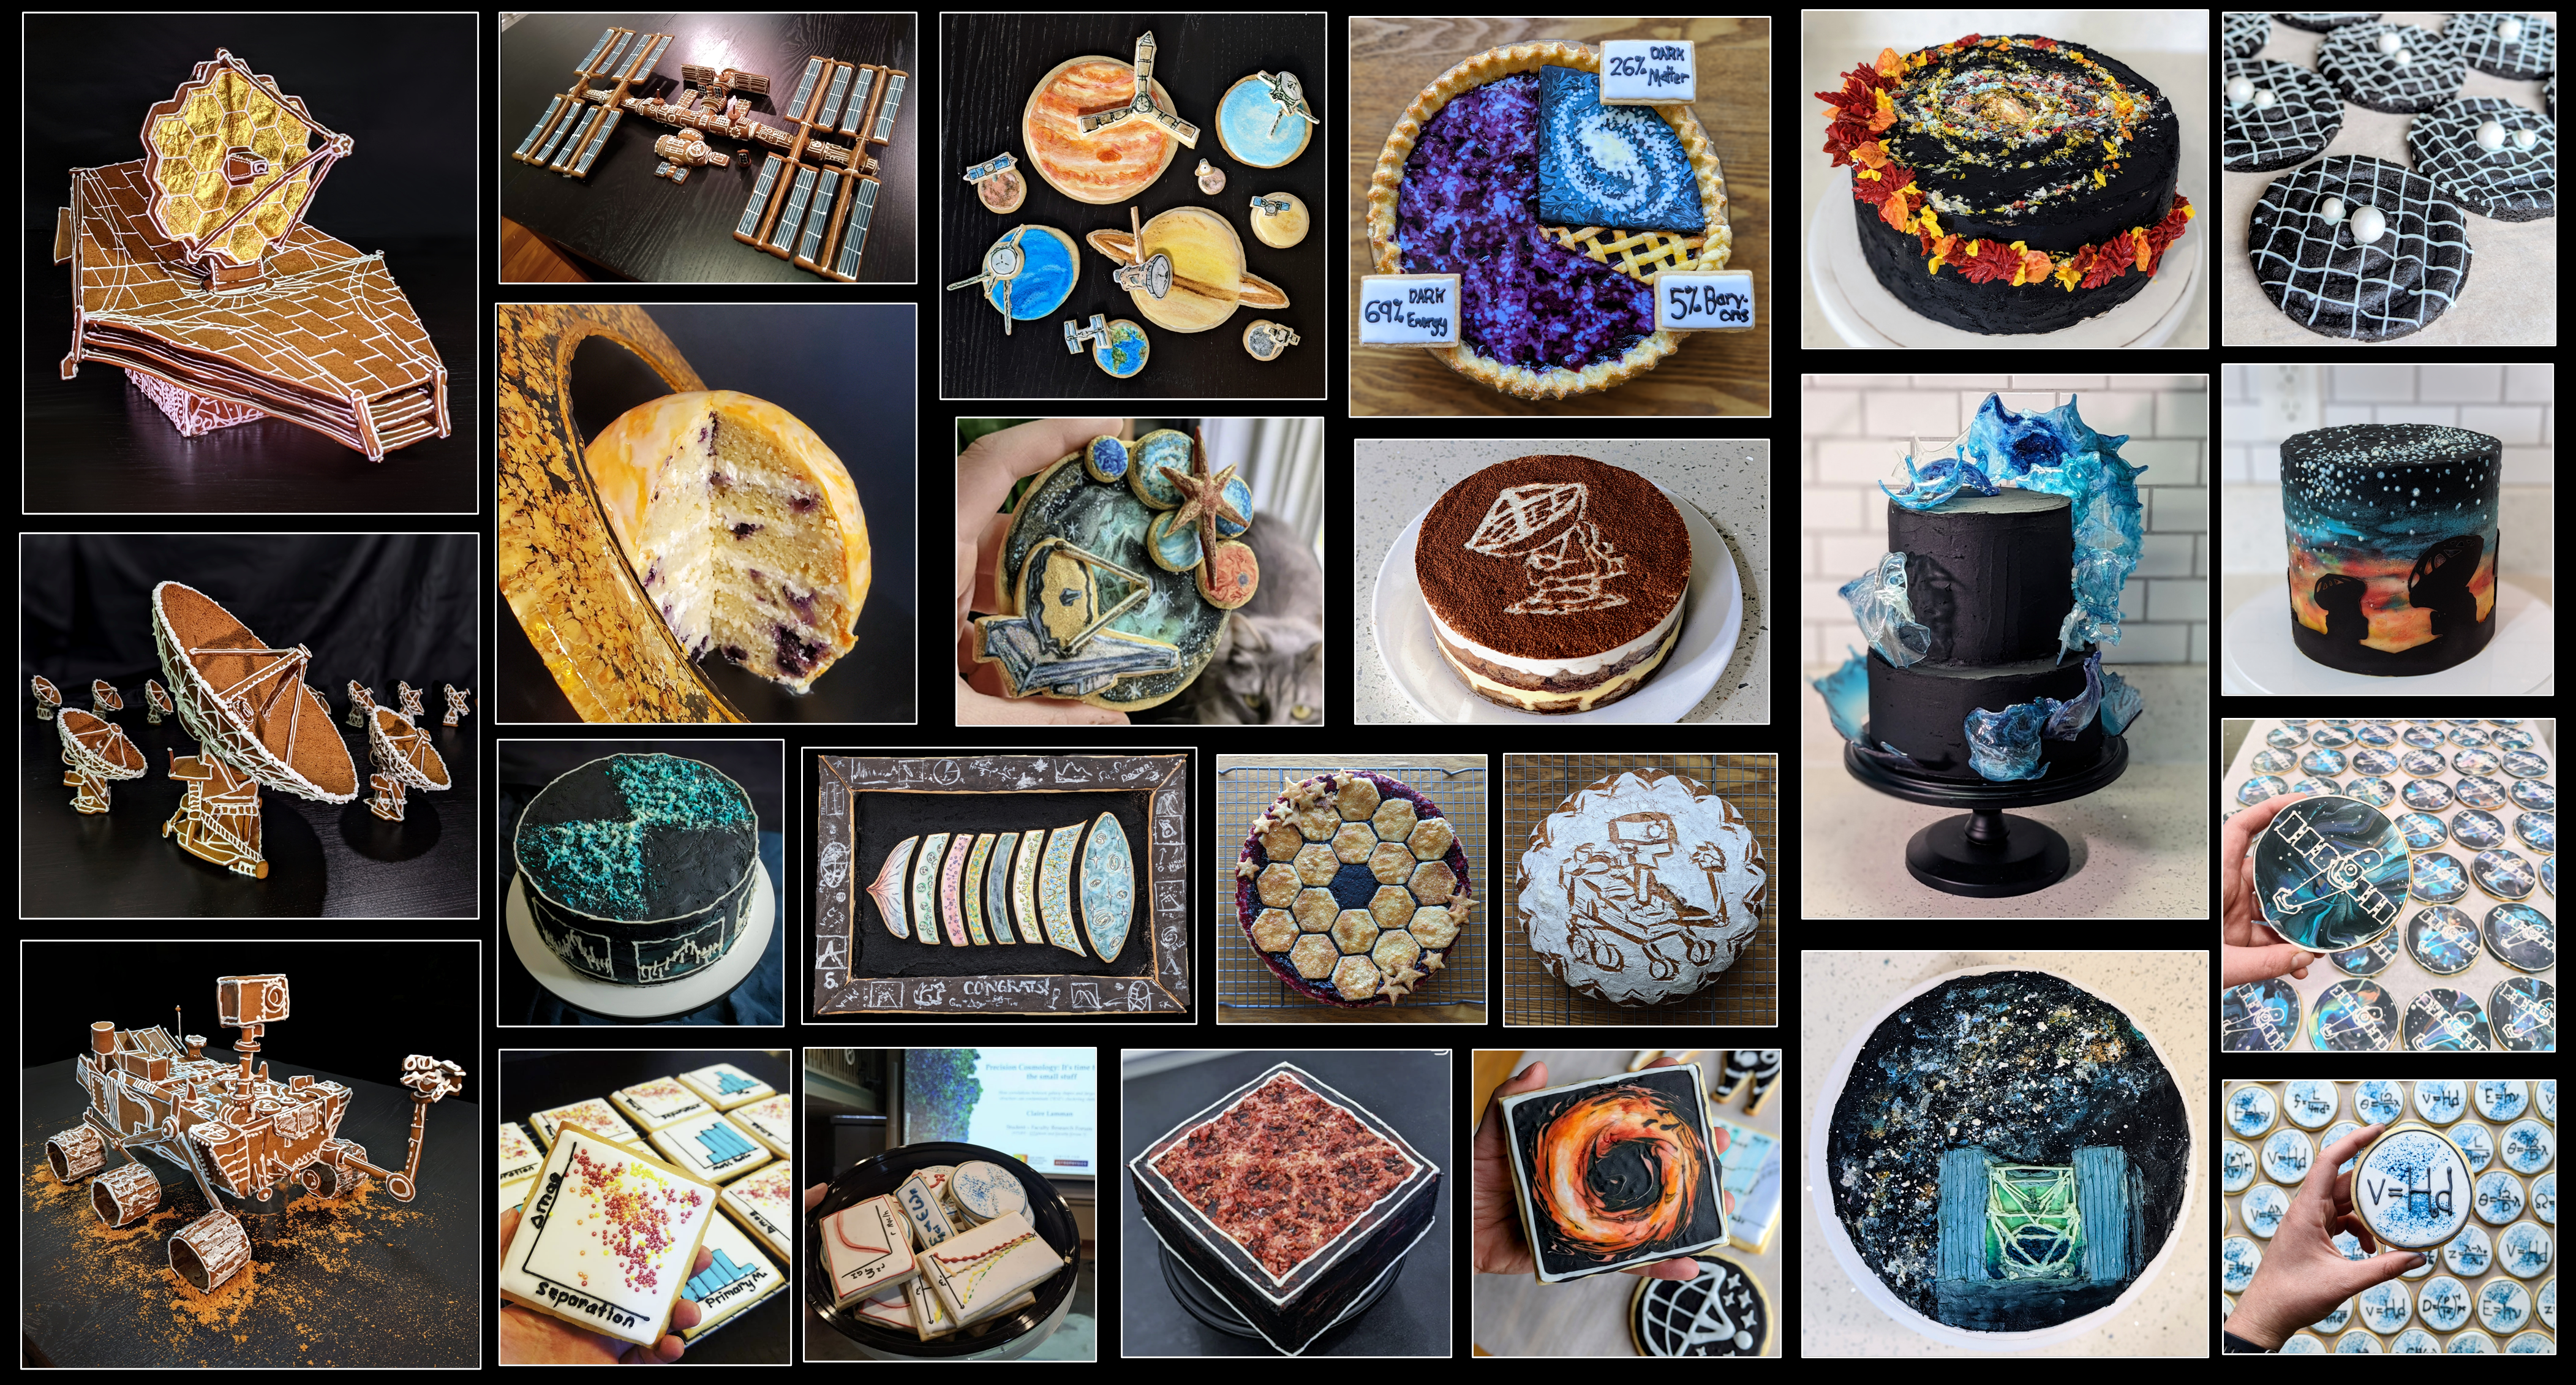
I create many astro-themed treats! To see all bakes and descriptions of the
science which inspired them, see my instagram.
5
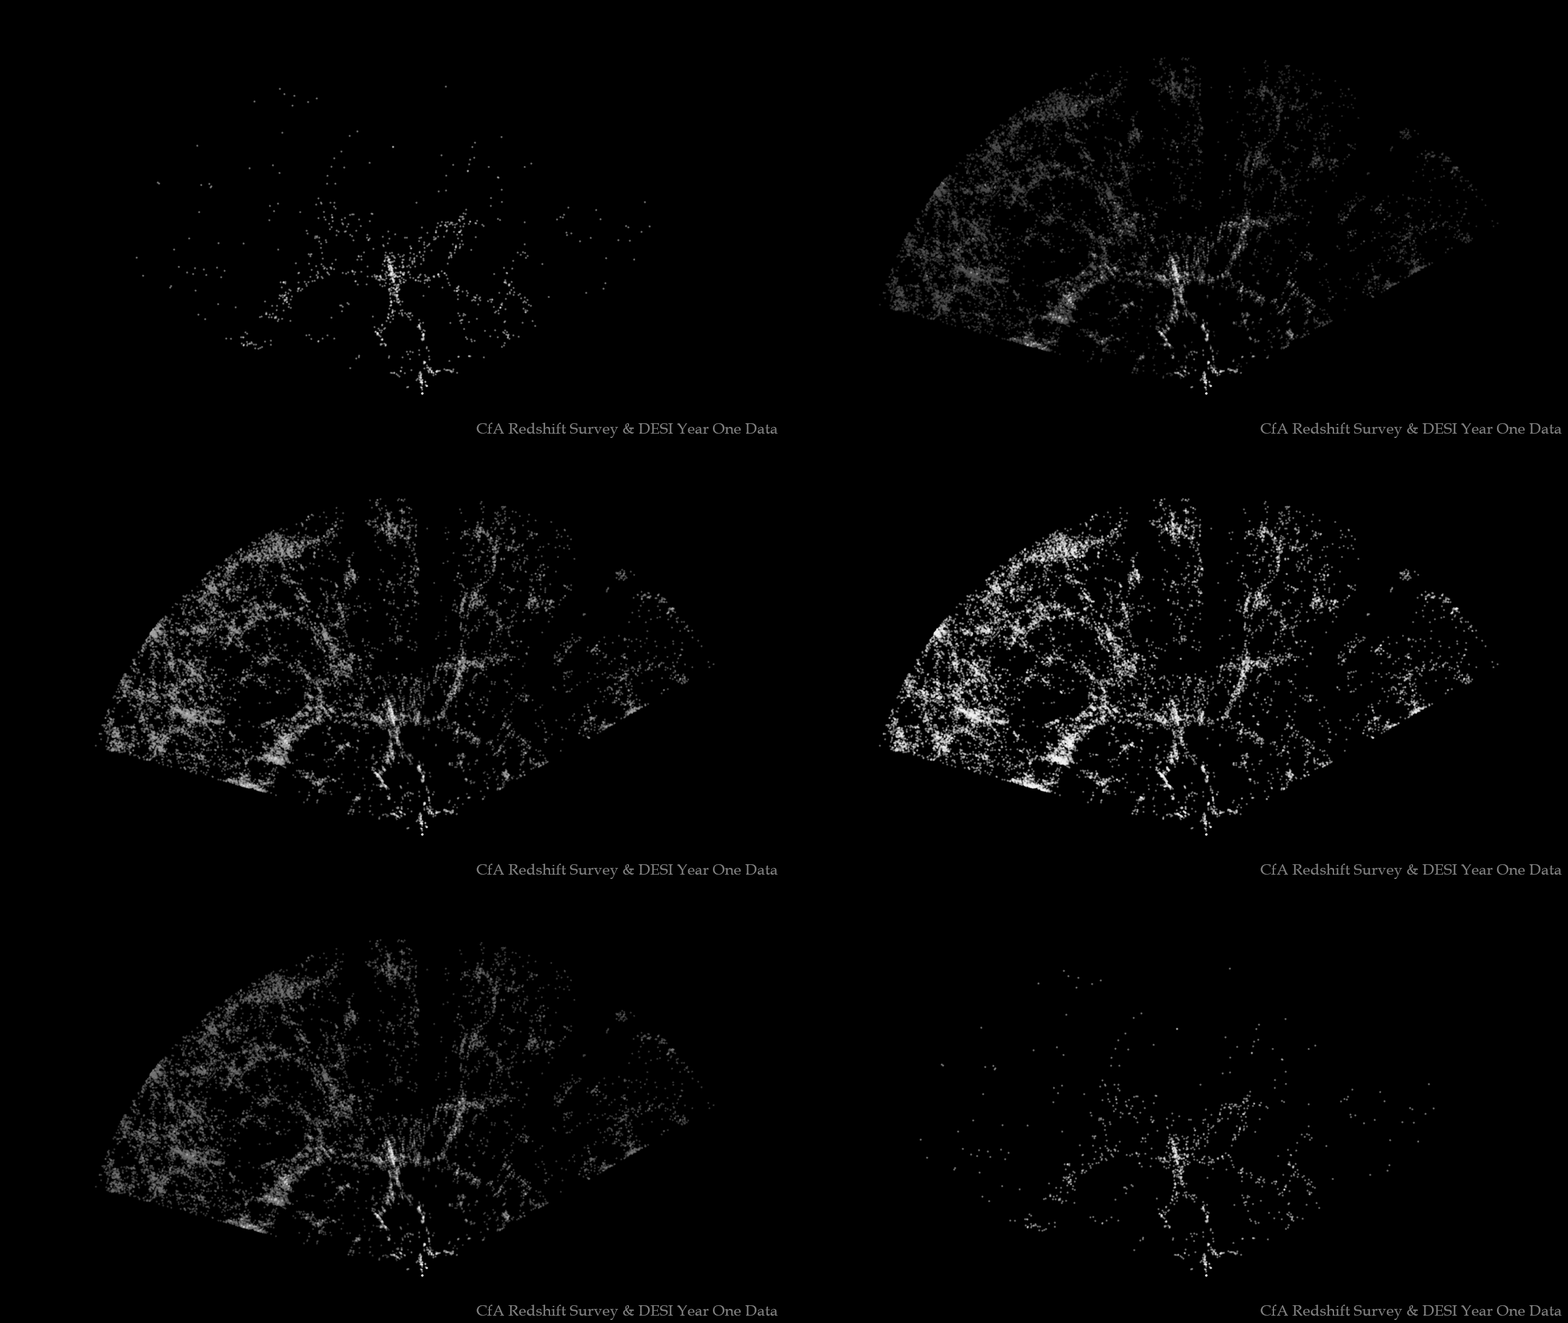
Comparison between the famous CfA "stickman" and the same slice with DESI Y1 galaxies. See
this blog post for more information. Credit: Claire Lamman | The CfA Redshift Survey: Data for the NGP +30 Zone. Huchra, Geller, de Lapparent, Corwin 1990
6

Design of DESI's LSS map and focal plane. Credit: Claire Lamman
7
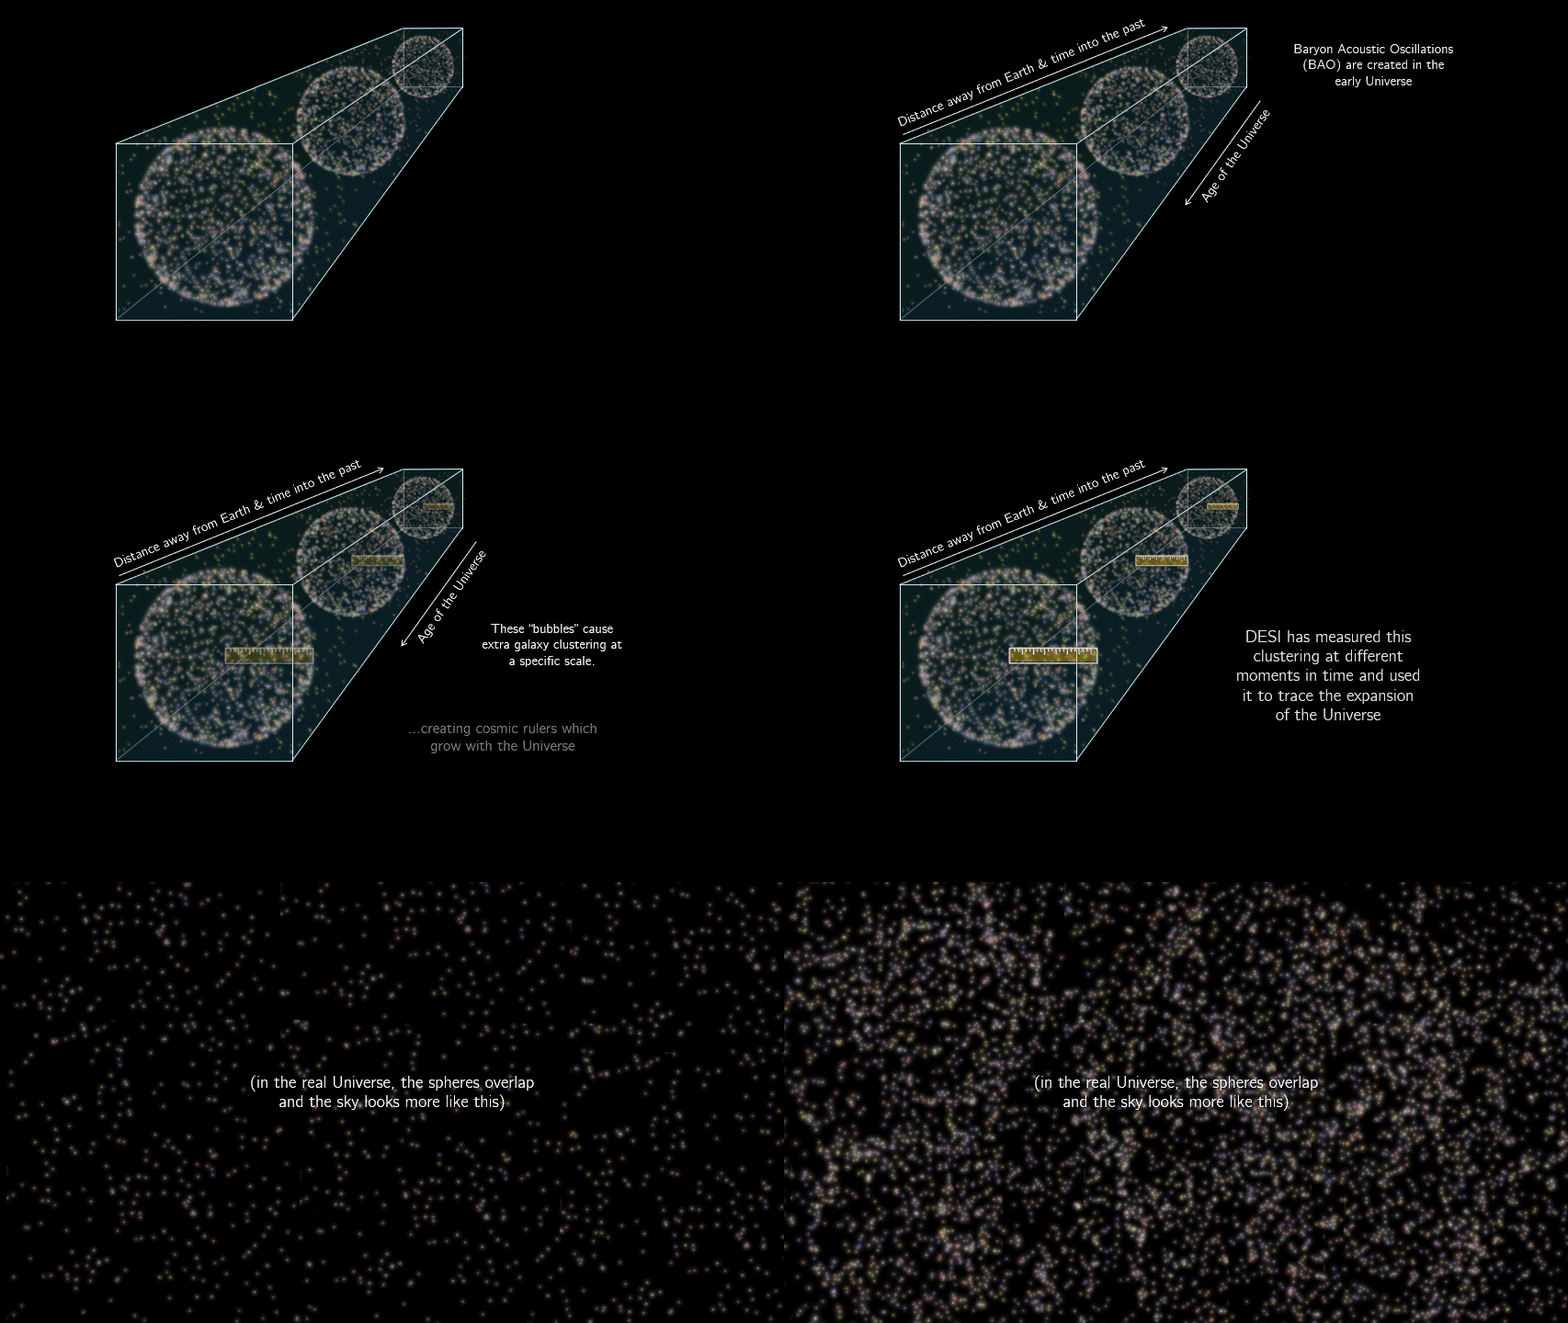
Visualization of BAO created for DESI's Y1 press release. For the final visualzation, see
this video from Berkeley Lab. Credit: Claire Lamman
8
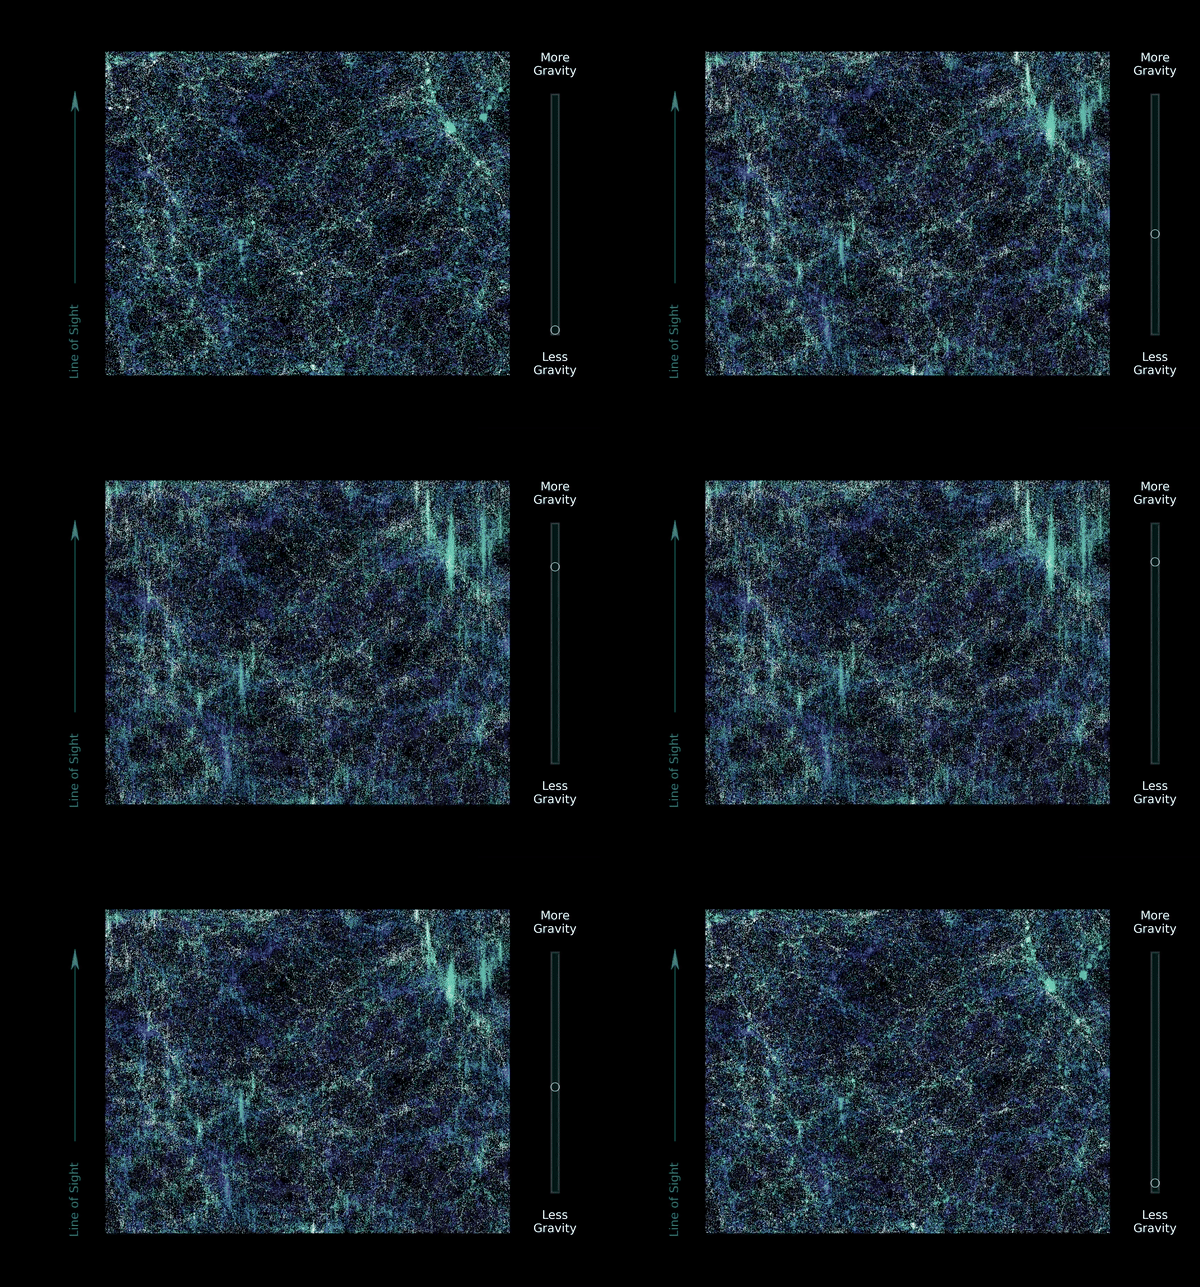
Visualization of RSD created for a DESI press release (Press release and high quality imaage coming soon!). Credit: Claire Lamman
9
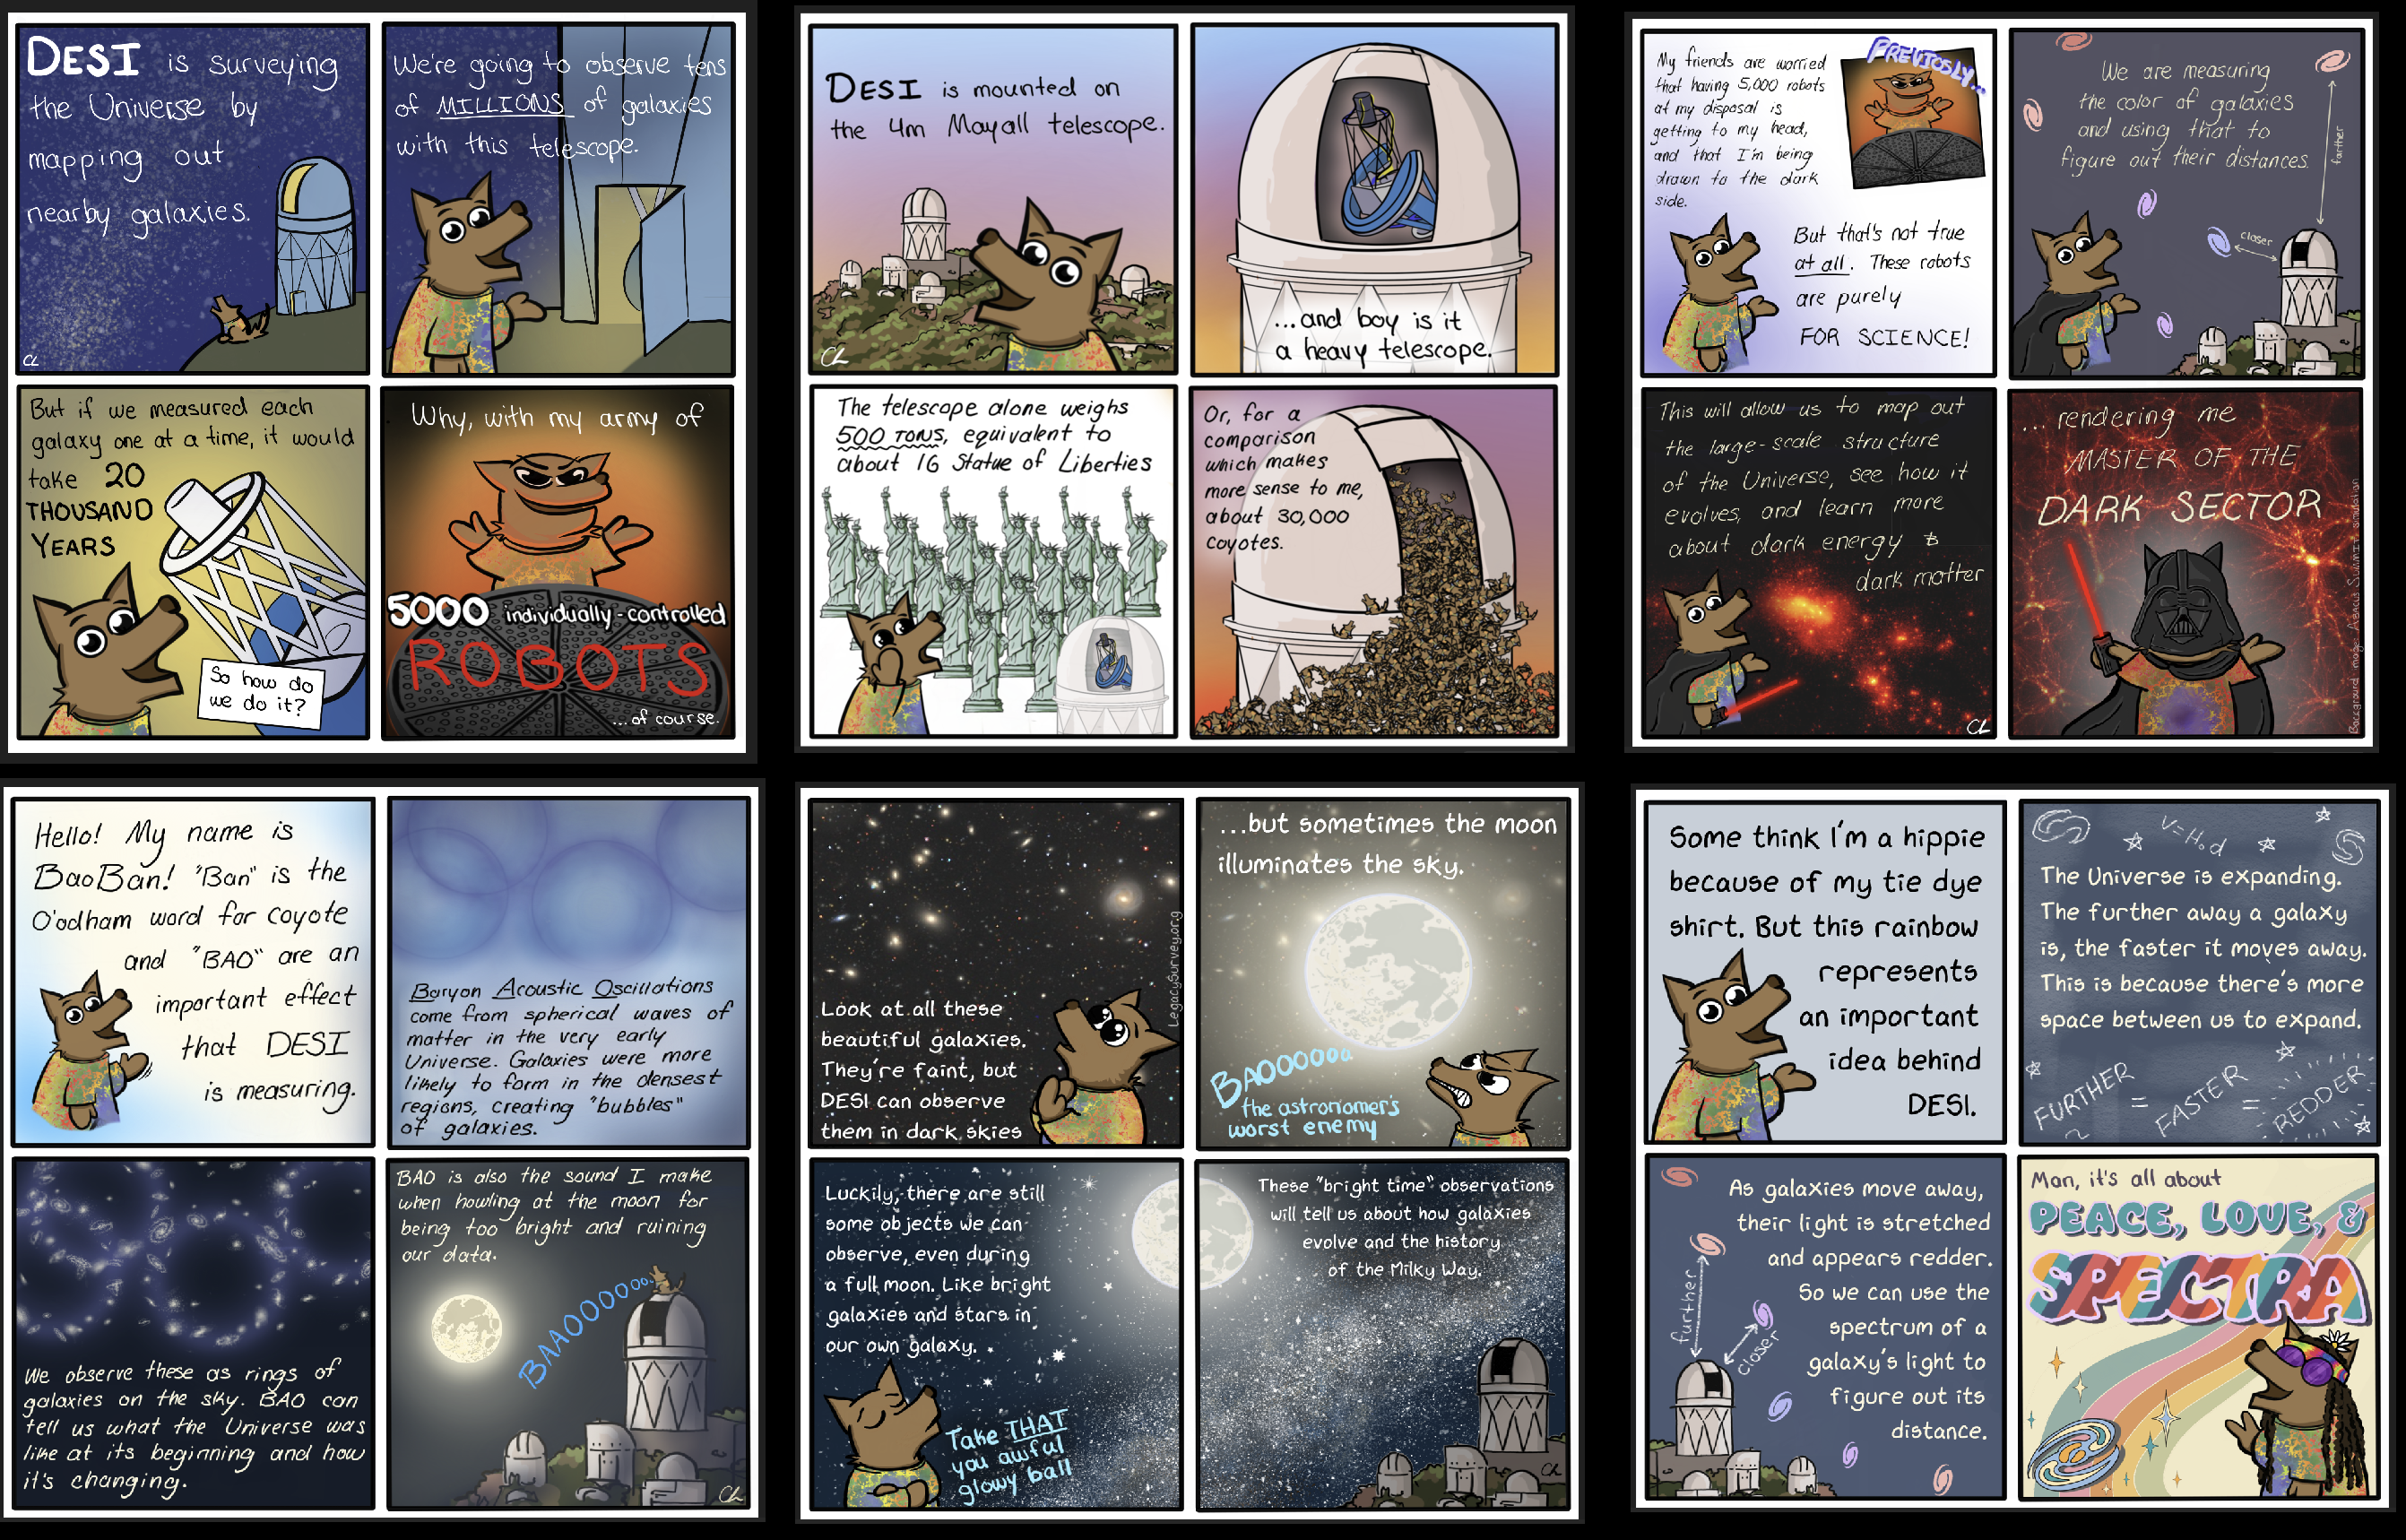
A series of comics featuring DESI's ambassador, BaoBan. Click here to see the full series. Credit: Claire Lamman
10
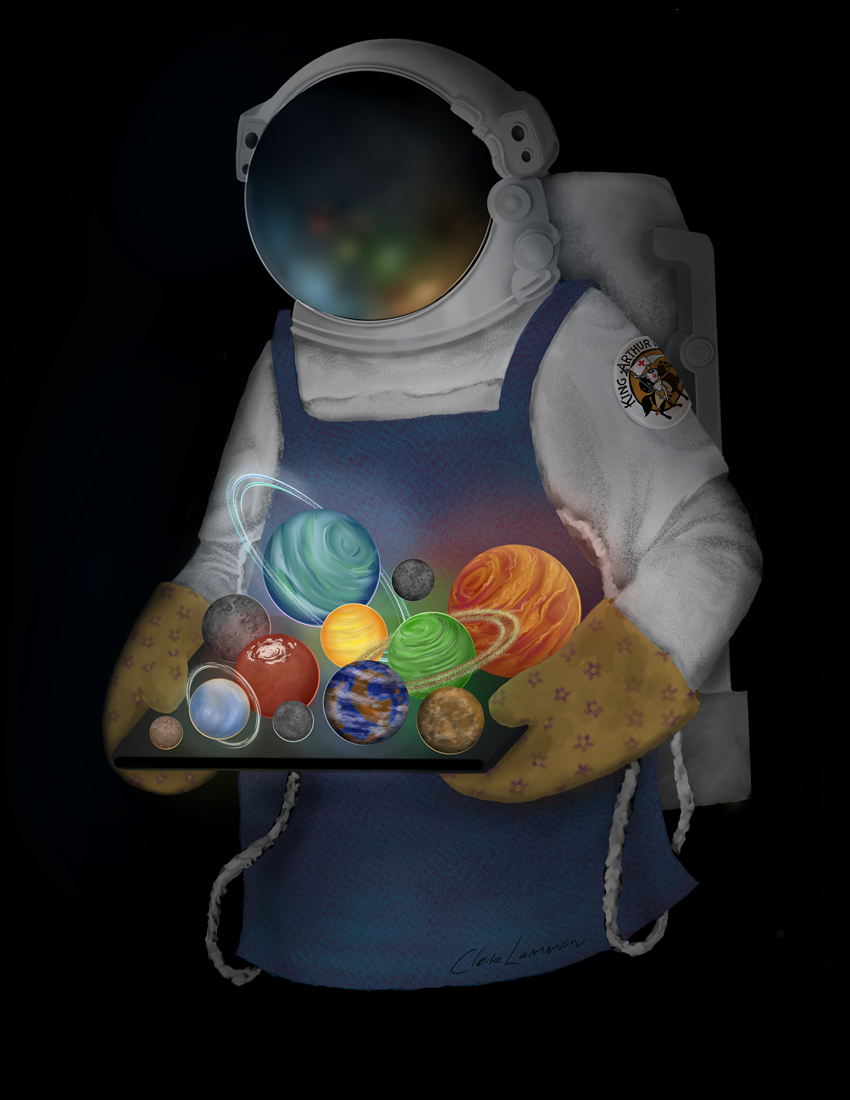
Made for fun during a boring observing night. Credit: Claire Lamman
1
2
3
4
5
6
7
8
9
10